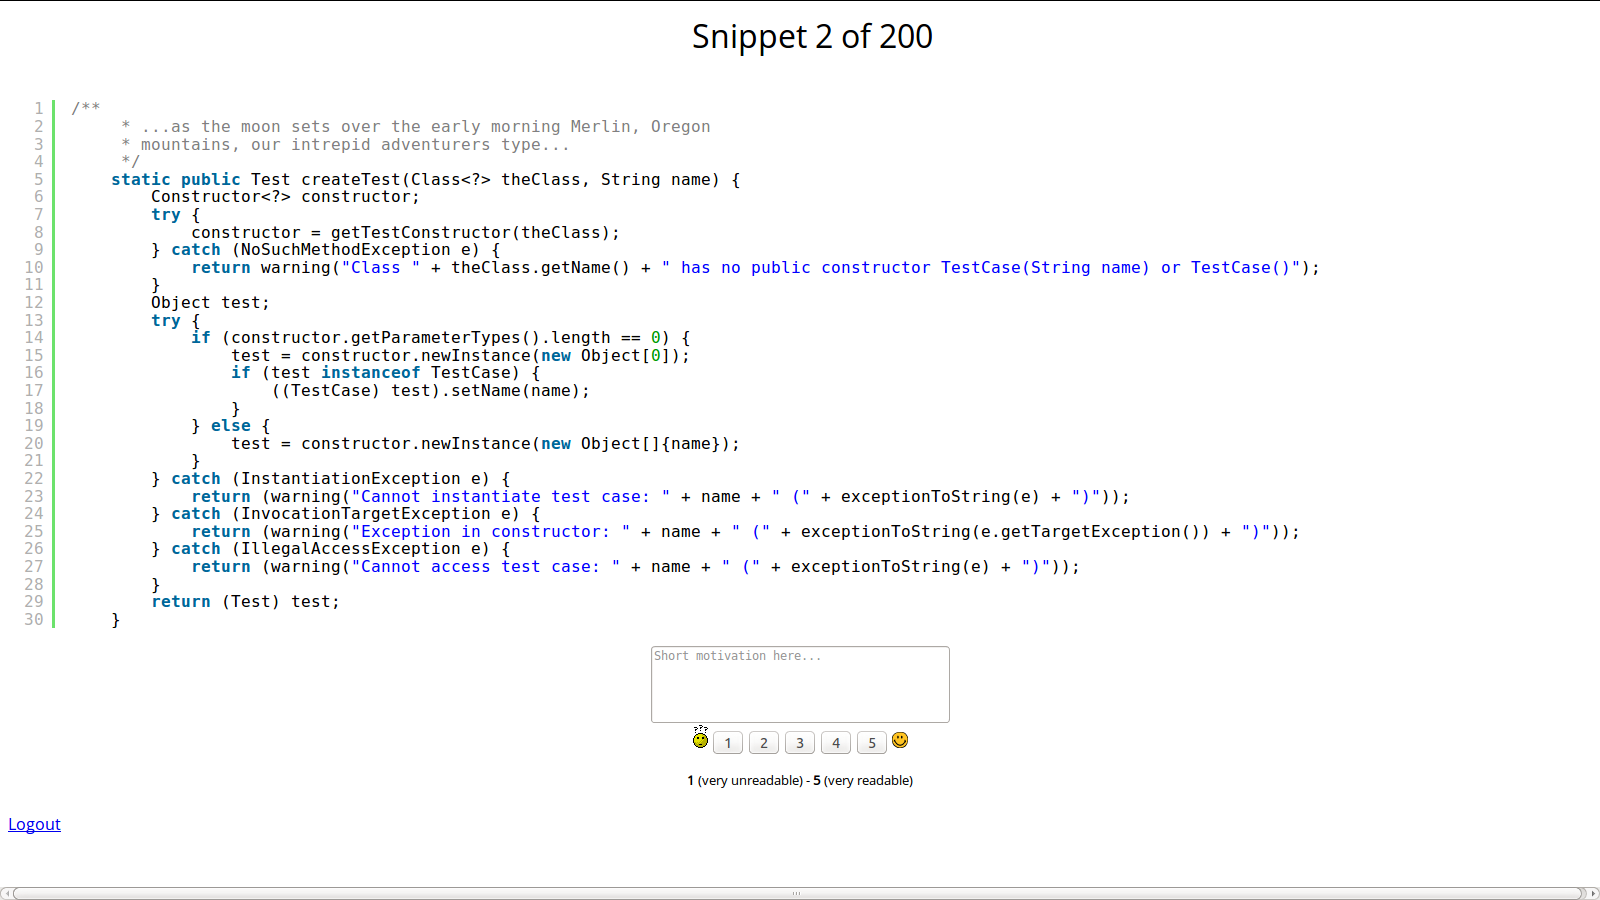
Abstract
Unreadable code could compromise program comprehension and it could cause the introduction of bugs. Code consists of mostly natural language text, both in identifiers and comments, and it is a particular form of text. Nevertheless, the models proposed to estimate code readability take into account only structural aspects and visual nuances of source code, such as line length and alignment of characters. In this paper we extend our previous work in which we use textual features to improve code readability models. We introduce two new textual features and we reassess the readability prediction power of readability models on more than 600 code snippets manually evaluated, in terms of readability, by 5K+ people. We also replicate a study by Buse and Weimer on the correlation between readability and FindBugs warnings, evaluating different models on 20 software systems, for a total of 3M lines of code. The results demonstrate that textual features complement other features and a model which contains all the features achieves a significantly higher accuracy as compared to all the other state-of-the-art models. Also readability estimation resulting from a more accurate model, i.e., the combined model, is able to predict more accurately FindBugs warnings.
Dataset
This dataset contains 200 method from four open source projects, namely:
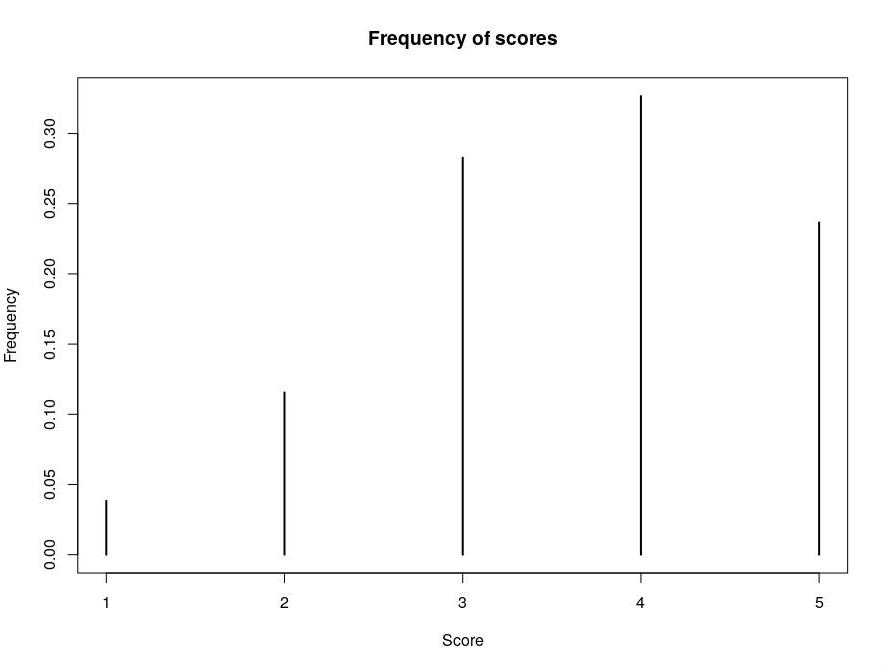
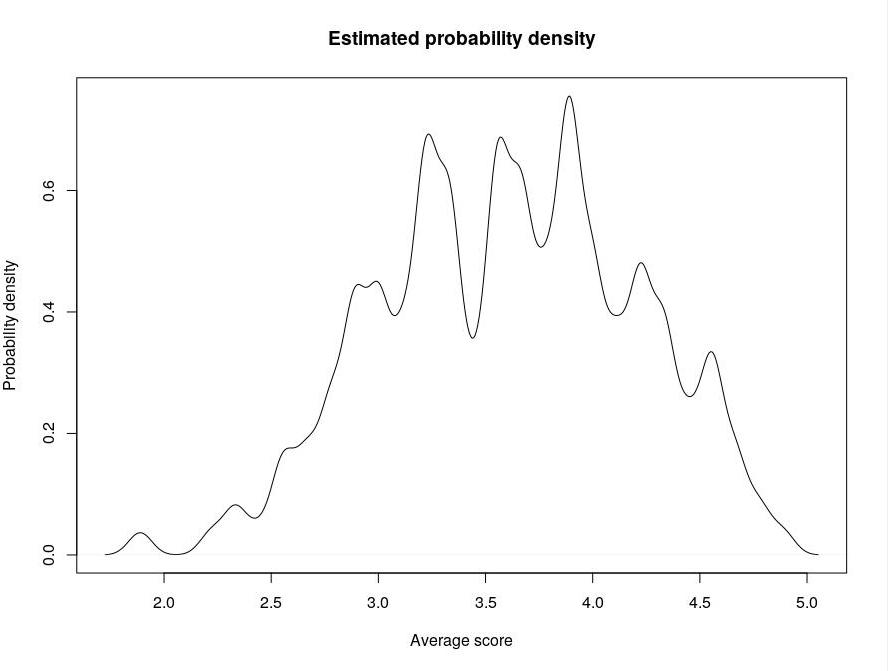
The methods were manually evaluated by 9 Computer Science studens from The College of William and Mary, Williamsburg, VA (USA). The participants were asked to evaluate the readability of each method using a five-point Likert scale ranging between 1 (very unreadable) and 5 (very readable). We collected the rankings through a web application where participants were able to:- read the method (with syntax highlighting);
- evaluate its readability;
- write comments about the method.
For each single snippet, it was computed the average score, in order to set a proper cut-off to distinguish readable snippets from unreadable ones. The following plots show (i) the frequency of each score and (ii) the (estimated) probability density of the average scores (bandwidth: 0.05):
Readability tool
You can download our tool for readability calculation clicking here. The model is trained on all the available datasets.
- Update (May 2021): the tool now allows to extract the values of all the metrics. See the README in the zip file.
Raw datasets
- Our new dataset
- Dataset by Buse and Weimer (copy of the original dataset, previously available here)
- Dataset by Dorn
Weka ARFF datasets (with features already computed)