Simone Scalabrino1, Gabriele Bavota2, Christopher Vendome3,
Abstract
Program understanding plays a pivotal role in software maintenance and evolution: a deep understanding of code is the stepping stone for most software-related activities, such as bug fixing or testing. Being able to measure the understandability of a piece of code might help in estimating the effort required for a maintenance activity, in comparing the quality of alternative implementations, or even in predicting bugs. Unfortunately, there are no existing metrics specifically designed to assess the understandability of a given code snippet. In this paper we perform a first step in this direction, by studying the extent to which several types of metrics computed on code, documentation and developers correlate with code understandability. To perform such an investigation we ran a study with 46 participants who were asked to understand eight code snippets each. We collected a total of 324 evaluations aiming at assessing the perceived understandability, the actual level of understanding and the time needed to understand a code snippet. Our results demonstrate that none of the (existing and new) metrics we considered is able to capture code understandability, not even the ones assumed to assess quality attributes strongly related with it, such as code readability and complexity.
Dataset
This dataset contains 50 methods from 10 open source projects, namely:
- OpenCMS
- Jenkins
- Spring Framework
- Hibernate ORM
- Weka
- ANTLR 4
- Apache Phoenix
- MyExpenses
- K-9 Mail
- Car report
- read the method (with syntax highlighting)
- answer the questions
- browse classes referred by the method they had to evaluate.

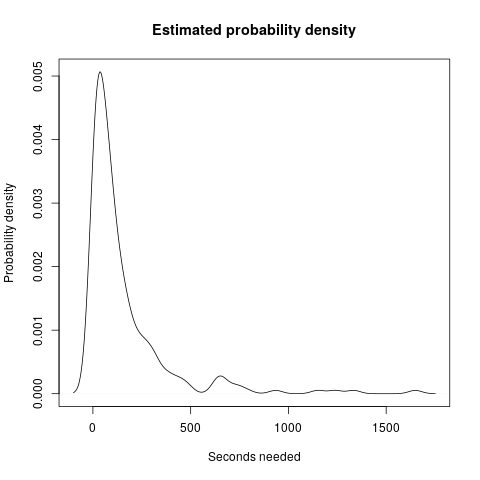
The participants answered "I understood the method" in 228 of the evaluations (70%). The mean time needed to understand a method is 154 seconds, while the median is 72 seconds. The figure below shows the estimated distribution of the time needed to answer.
We correlated 121 metrics to four proxies of understandability. As a first step, for each pair of metrics exhibiting a strong correlation (i.e., with a Kendall’s |τ| ≥ 0.7), we excluded the ones which presented the highest number of missing values or, if equals, one at random. We reduced the number of investigated metrics from 121 to 74. Click here to view the list of excluded metrics (and the correlation with the included metric).
Raw data
- Raw dataset. Each row includes information about (i) the evaluator, (ii) the method (included all the metrics) and (iii) all the understandability variables
- Total number of upvotes for all the external APIs in the systems taken into account
- Popularity of Java classes
- Verification questions (the first is always the correct answer; in the webapp the answers are shuffled)