Simone Scalabrino1, Gabriele Bavota2, Christopher Vendome3,
Abstract
Understanding software is an inherent requirement for many maintenance and evolution tasks. Without a thorough understanding of the code, a developer would not be able to adequately test the software nor fix bugs in a timely manner. Being able to measure the understandability of a piece of code might be useful to guide developers in writing more maintainable code, and could also help in estimating the effort required to perform modifications to a code component. Unfortunately, there are no existing metrics specifically designed to assess the understandability of a given code snippet. In this work, we perform an extensive evaluation of existing and new code-related, documentation-related, and developer-related metrics (for a total of 121 metrics) to determine whether they correlate with code understandability. We ran a study with 57 participants who were asked to understand eight code snippets each. We collected a total of 396 evaluations and used them to assess their perceived and actual level of understanding, and the time needed to understand a code snippet. The output of such a study was a strong negative result, reporting none of the 121 experimented metrics as able to capture code understandability, not even the ones assumed to assess quality attributes strongly related with it, such as code readability and complexity. Subsequently, we built models combining metrics to assess whether they could help in better assessing code understandability. While we observed some improvements, their effectiveness is still far from levels needed to make them suitable in practice. Finally, with the goal of identifying directions for future work and possible new metrics to include in our models, we conducted interviews with developers to understand the factors that influence their ability to understand a snippet of code.
Dataset
This dataset contains 50 methods from 10 open source projects, namely:
- OpenCMS
- Jenkins
- Spring Framework
- Hibernate ORM
- Weka
- ANTLR 4
- Apache Phoenix
- MyExpenses
- K-9 Mail
- Car report
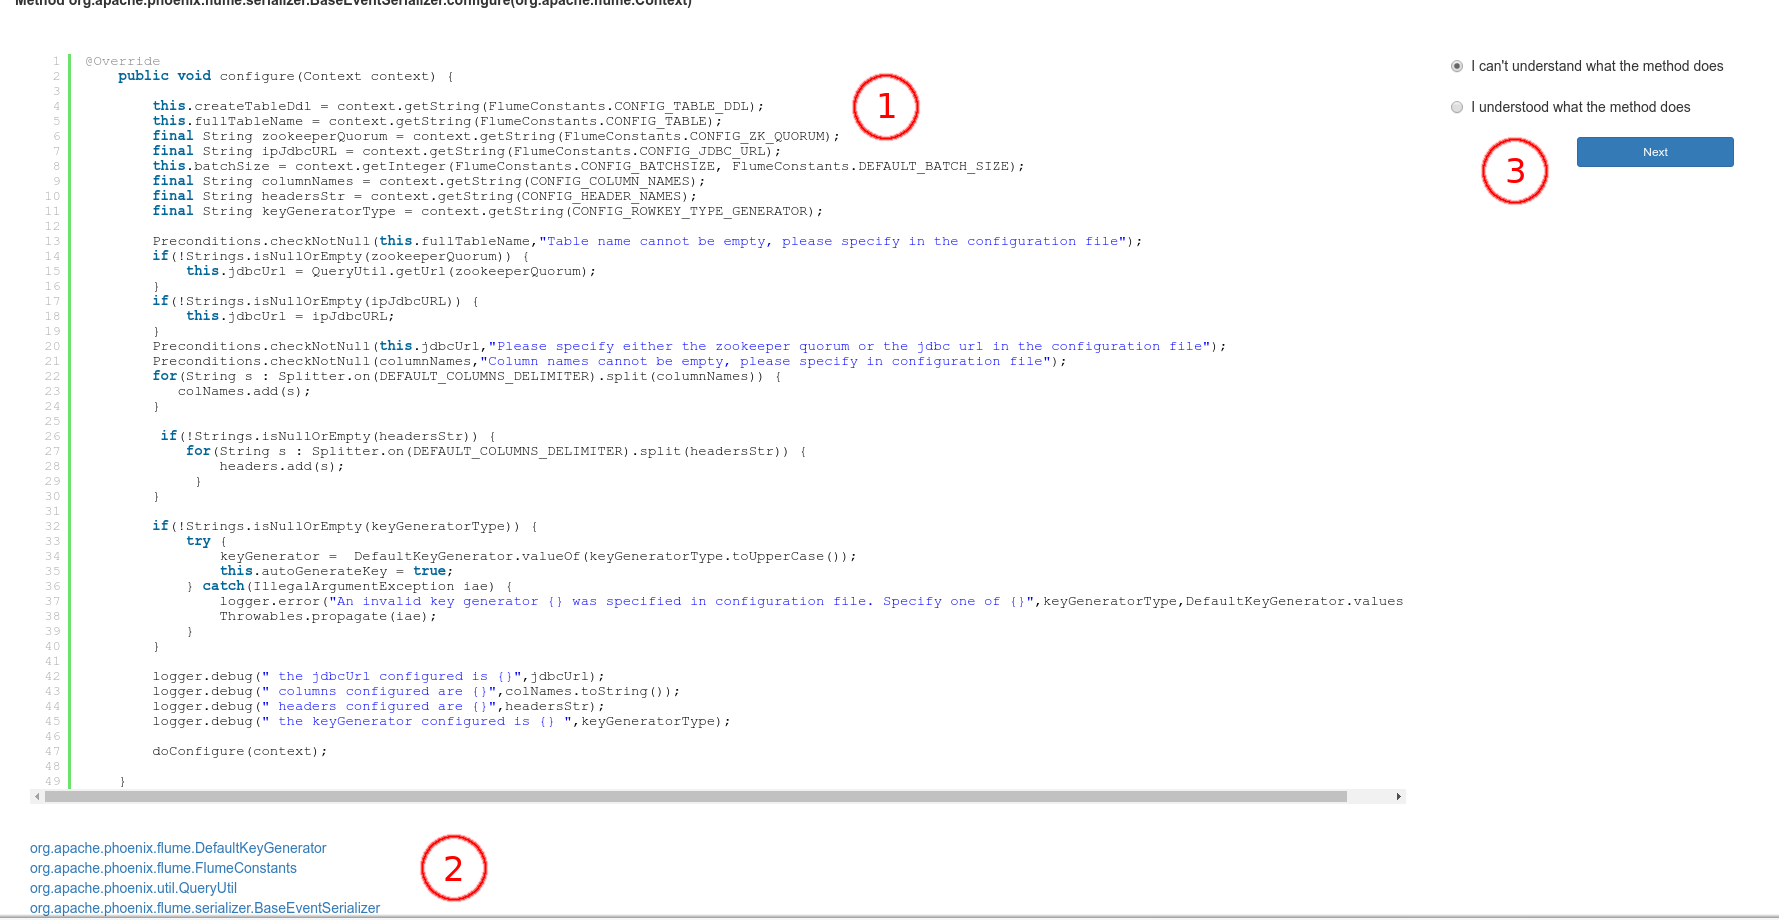
- read the method (with syntax highlighting)
- answer the questions
- browse classes referred by the method they had to evaluate.
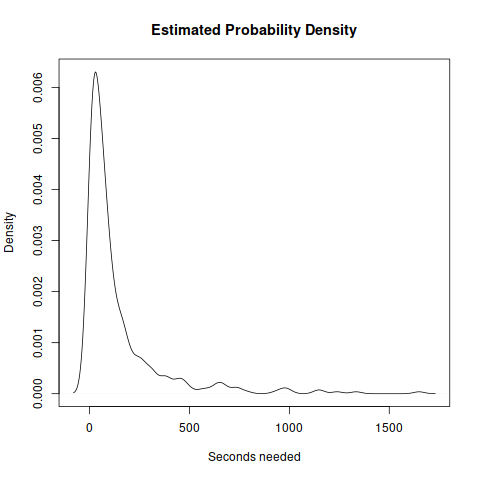
The participants answered "I understood the method" in 228 of the evaluations (70%). The mean time needed to understand a method is 141.8 seconds, while the median is 64.5 seconds. The figure below shows the estimated distribution of the time needed to answer.
We correlated 121 metrics to four proxies of understandability. As a first step, for each pair of metrics exhibiting a strong correlation (i.e., with a Kendall’s |τ| ≥ 0.7), we excluded the ones which presented the highest number of missing values or, if equals, one at random. We reduced the number of investigated metrics from 121 to 73.
Metrics
- Total number of upvotes for all the external APIs in the systems taken into account;
- Popularity of Java classes.
Survey
- Systems. The complete list of the snapshot of software systems we took into account;
- Verification questions (the first is always the correct answer; in the webapp the answers are shuffled).
Raw Data
- RQ1: Raw dataset. Each row includes information about (i) the evaluator, (ii) the method (included all the metrics) and (iii) all the understandability variables;
- RQ2: Replication package. It includes a README.md file which explains the structure of the package.